
With 30 unique stadium designs, MLB stands out among its major professional counterparts. Unlike the NHL, NBA and NFL, where playing dimensions are uniform, MLB’s various weather patterns and wall arrangements create distinct scoring environments across the league.
In that sense, the playing field is not level. By identifying which MLB ballpark factors stick out — from friendliest to least forgiving — bettors can make more informed wagers when exploring the player prop market and deciding whether to bet the over or under on totals.
Note: The data in this article derives from a three-year rolling average (2022-24) from Statcast's park factors page unless otherwise stated.
 BET FINDER: Search & Bet!
MLB ballpark factors: Overall run scoring
The best: Coors Field, Colorado Rockies
Coors Field is (and likely always will be) the top run-scoring environment in baseball. It caters to 25% more run production than the average park, and at least a 15% bump in singles, doubles and triples.
The foundation of this mountainous run machine is its atmosphere. Situated roughly a mile above sea level, Coors Field has lower atmospheric pressure and air density than other parks. That means less drag — and more distance — for the baseball.
Peter Hamlington, a University of Colorado professor of mechanical engineering, explained last summer that spin rates decrease at altitude, which negatively affects the ball’s ability to travel. But that also affects off-speed pitches (for instance, curveballs don’t curve as much at Coors), and it doesn’t do enough to counteract the reduced drag of a ball in flight.
Other excellent run-scoring environments exist in Boston (14% above average) and Kansas City (10%), both of which we’ll touch on later.
The worst: T-Mobile Park, Seattle Mariners
The Seattle Mariners have the stingiest scoring setting (17% below average), with the San Diego Padres (Petco Park), San Francisco Giants (Oracle Park) and Tampa Bay Rays (Tropicana Field) all right behind at 8% below average. Seattle is also alone in last place for batting average on contact (6% below average).
Why are some of these parks so run-deficient? In Seattle's case, we know We know that Seattle's 2024 offence was supremely underwhelming.
But there's more to it than that. Using Statcast’s environmental factors, we know that Seattle, San Diego and San Francisco are the three coldest venues in the sport. Combine that with their sea-level status, and these West Coast parks see the ball travel less than it does elsewhere.
MLB ballpark factors: Home runs
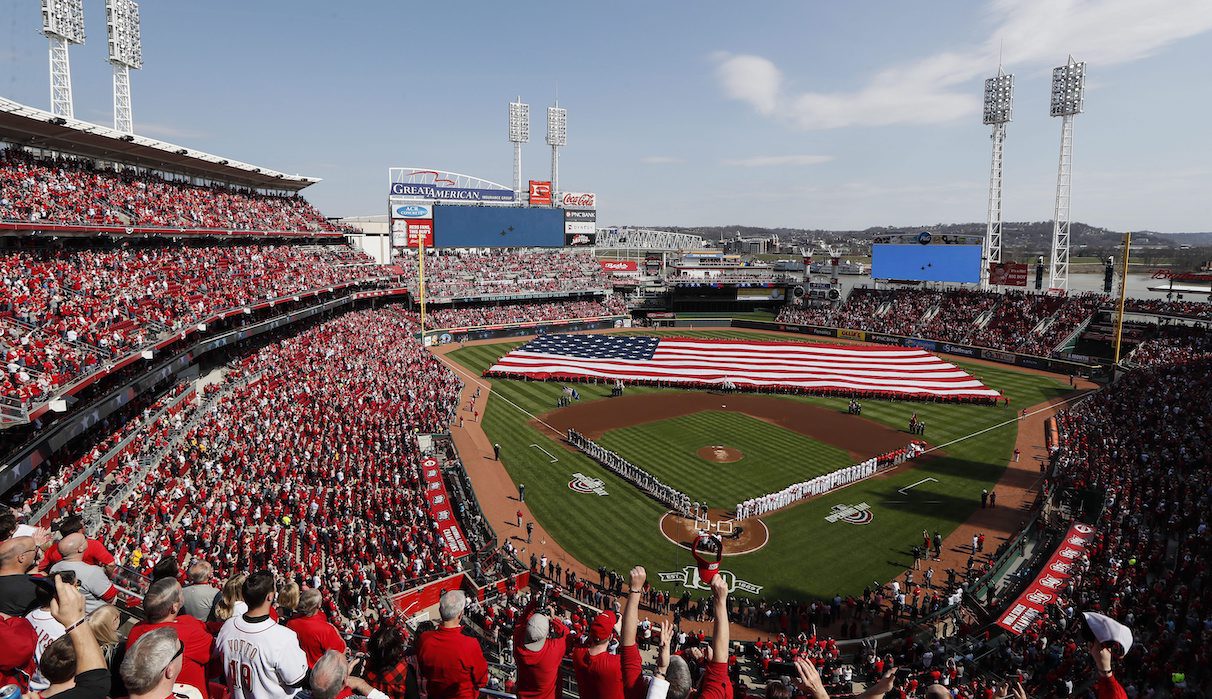
The best: Great American Ball Park, Cincinnati Reds
Have you ever dreamed of catching a big-league home run ball? Well, grab a mitt and head to Cincinnati, where home runs are hit 26% more often than normal.
The simplest explanation is the short porches: 328 feet in left field and 325 feet in right. While the left-field wall is elevated to 12 feet, the same can't be said for right field, where lefties like Joey Votto used to deal damage on almost a daily basis.
Los Angeles’ Dodger Stadium (21%) benefits from a star-studded lineup, which has finished top-five in homers each of the past seven seasons.
Every wall at Dodger Stadium is standard size (eight feet) and fewer than 400 feet from home.
The worst: Oracle Park, San Francisco Giants
A healthy gust of wind can aid a long ball in the Bay Area, but it can just as easily knock one down. San Fran, which plays in the second-coldest average temperature, allows 21% fewer home runs than average.
Oracle Park has a curiously short wall in the right-field corner (309 feet), but that’s offset by the wall’s 24-foot height ... unless you’re, say, Barry Bonds. The right-centre power alley stretches 421 feet, which is great for extra bases, but brutal for four-baggers.
Kansas City’s Kauffman Stadium (14% below average) hosted all-star festivities in 2012, which led to an all-time disastrous home run derby performance. Robinson Cano, who’d won the 2011 contest, failed to hit a single ball out of the yard.
MLB ballpark factors: Triples and doubles
The best (for triples): Coors Field, Colorado Rockies
We've already highlighted Coors Field as a run-scoring haven, so let's touch on a different park as one of the best for producing triples.
With a 420-foot fence in centre, Detroit's Comerica Park is one of baseball’s worst fields for home runs. But boy, there sure is a ton of space for triples.
Take this June 9, 2021 knock by Isaac Paredes, whose deep fly found the grass in the deepest part of the park. Paredes ranked in the 37th percentile in sprint speed in that season, but thanks to Comerica's generous dimensions, he managed to leg out his first career triple.
All told, the Tigers’ home field allows 43% more triples than average.
The best (for doubles): Fenway Park, Boston Red Sox
The Green Monster, Fenway’s 37-foot wall in left field, gobbles up would-be home runs and spits out doubles. The Monster is only 310 feet from home plate, representing one of the shortest porches in baseball. And its stature makes extra bases extra easy.
Bobby Dalbec should consider penning a thank you note to a relative of Fenway’s architect, James E. McLaughlin.
This was a true Fenway Park special. Bobby Dalbec’s double had a .010 xBA(!!!) according to Statcast.
— Brent Maguire (@bmags94) May 15, 2021
It scored two runs for Boston. pic.twitter.com/IQnhNlBzhM
Fenway is 24% more favourable for doubles than the average park. Though its home run rate is slightly below average, the presence of the iconic Green Monster is a worthwhile trade-off at this 110-year-old park.
The worst: Mariners, Mets, Brewers
T-Mobile is not a particularly large park, and we’ve already discussed how chilly temperatures and lack of elevation sap its power. Plus, there are no quirky outfield angles to create the type of peculiar bounces that aid some triples.
Several stadiums are in a similar range for fewest doubles, though, so it's not as if Seattle really stands out.
The Mets' Citi Field and Brewers' American Family Field are 14% and 11% below average, respectively, in terms of producing doubles.